The M.I.D.E.N. transports you into Nova’s Reality
Using Virtual Production Techniques to Film a Music Video
Author
Emma Powell and Eilene Koo

Photo Credit: Eilene Koo
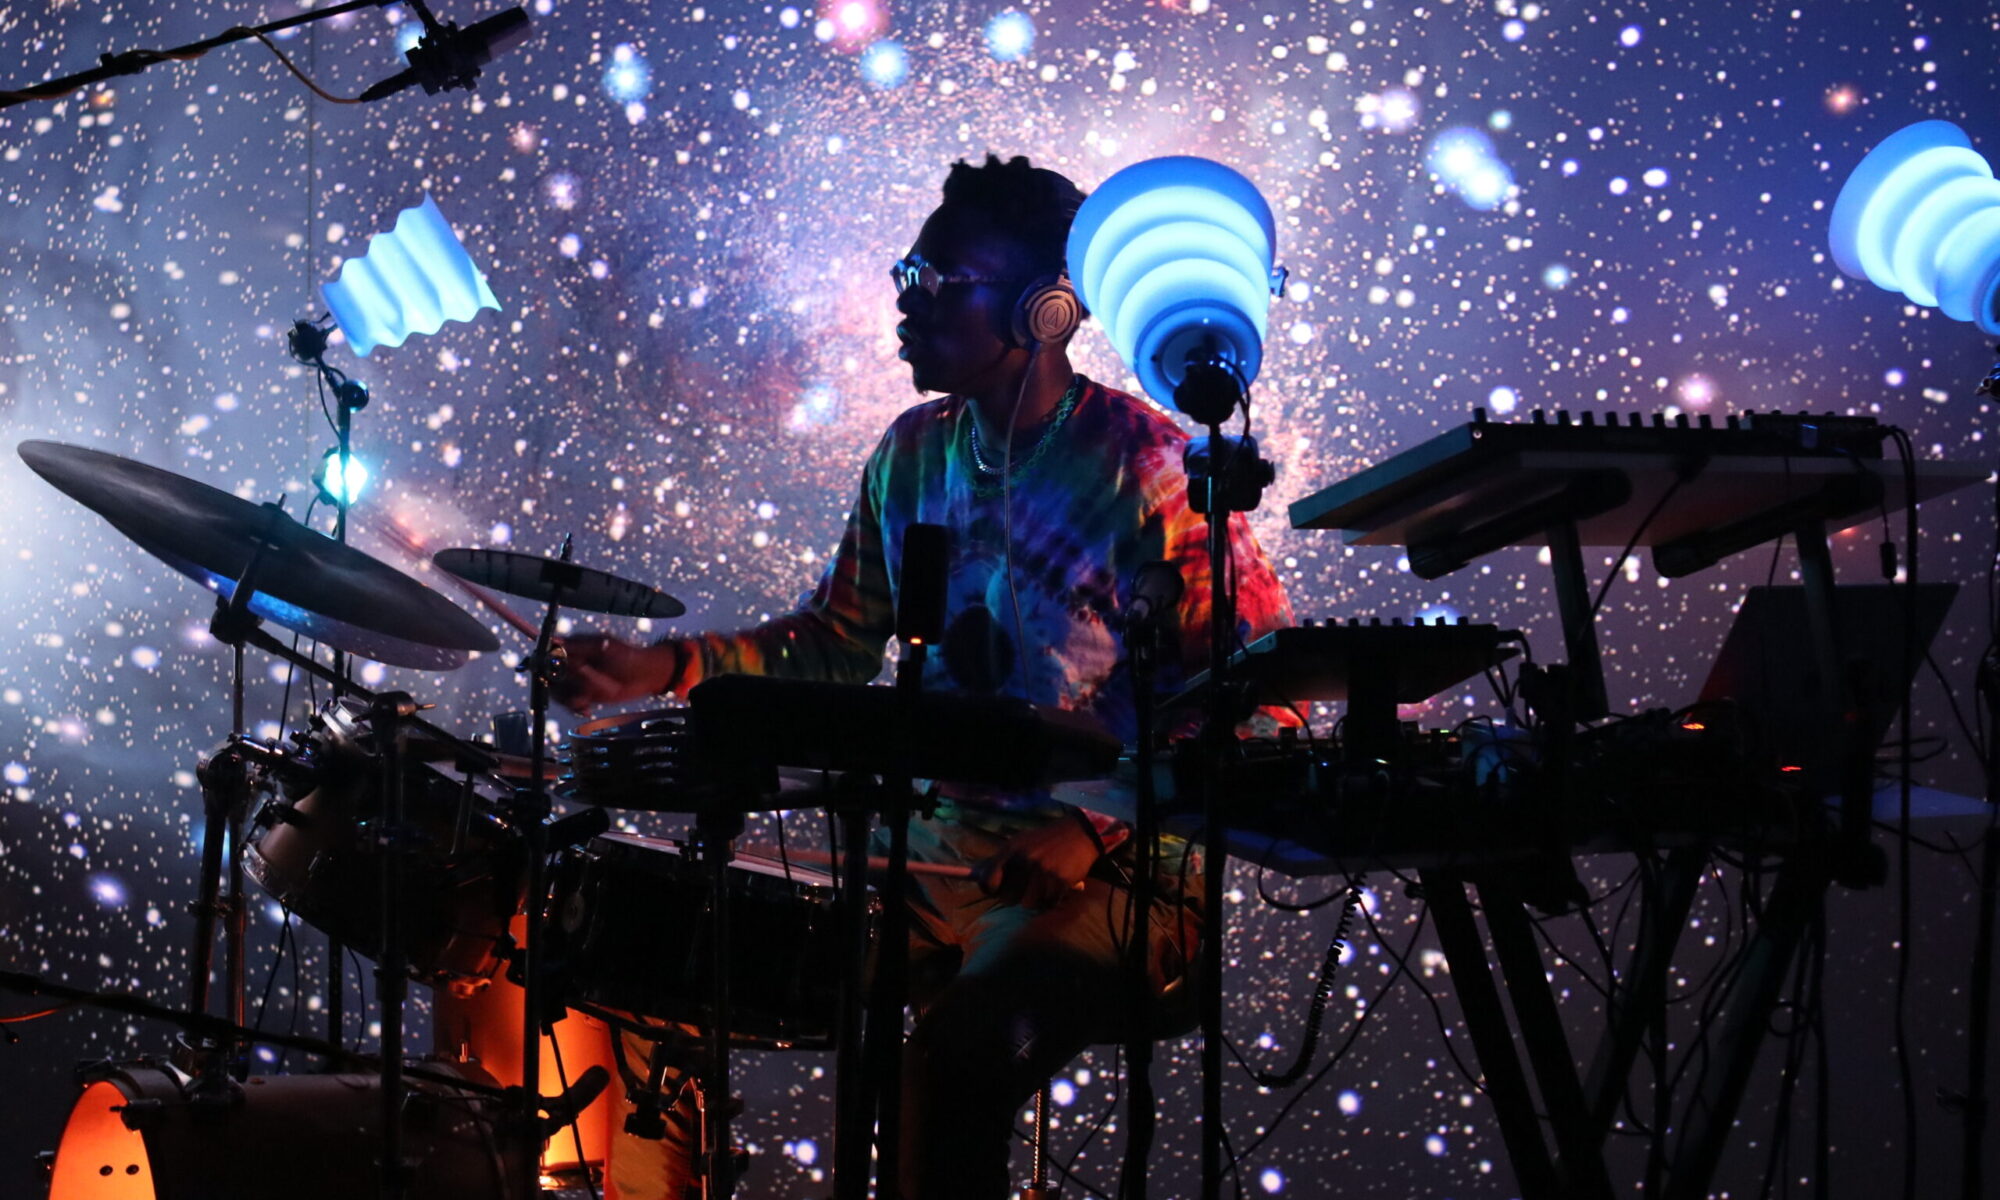
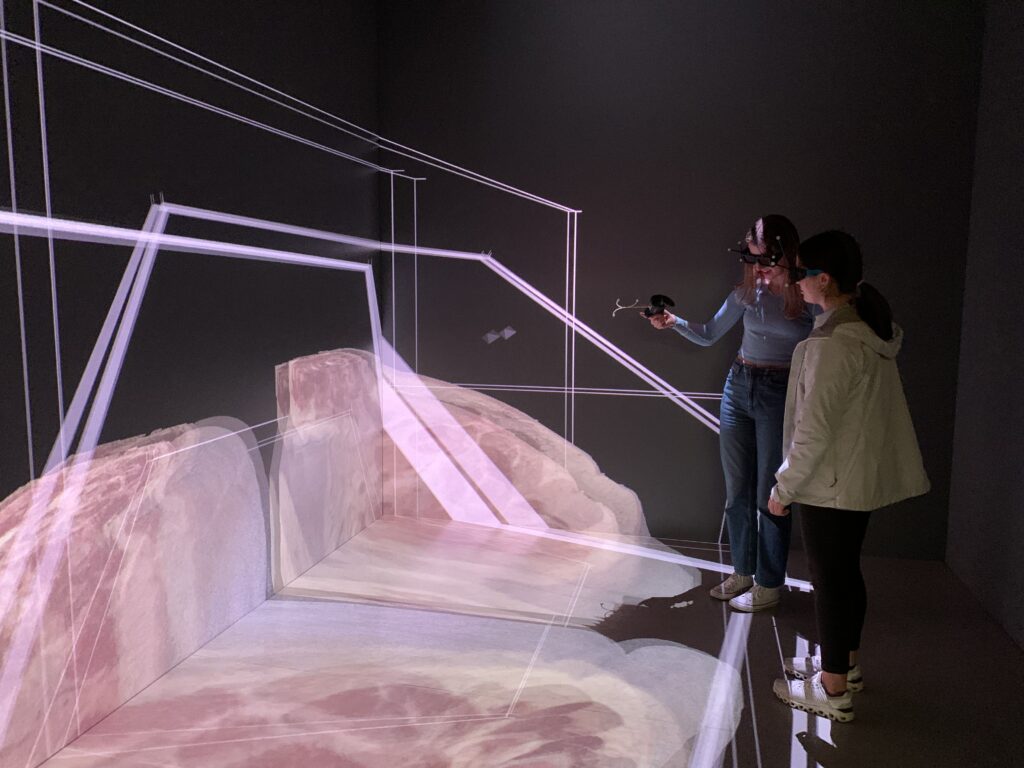
The Michigan Immersive Digital Experience Nexus (MIDEN) doesn’t seem very large at first, as it is a 10 x 10 x 10 foot space and a blank canvas ready for its next project like “Nova’s Reality.” For this special performance, though, the MIDEN transformed into an expansive galactic environment, placing electronic jazz musician Nova Zaii in the middle of a long subway car traveling through space.
The technological centerpiece of Zaii’s performance was the Nova Portals, a cone-shaped instrument invented by Zaii which uses motion and doesn’t require direct contact to create sound. Zaii created the Nova Portals during his time as a student at the University of Michigan and majoring in Performing Arts Technology and Jazz Studies.
Several members of the U-M community helped bring Zaii’s performance to life inside the MIDEN. Akash Dewan, a graduated senior and director of the project, first met Nova in his freshman year. “I first met Nova in my freshman year in the spring, when I decided to shoot Masimba Hwati’s opening ceremony for his piece at the UMMA,” Dewan said. Masinba Hwati is a Zimbabwean sculptor and musician who made the Ngoromera, a sculpture made out of many different objects and musical instruments. When Hwati performed at the opening ceremony, his drummer was Nova Zaii.
“I took photos throughout the performance and took some particularly cool photos of Nova, so I decided to chat with him after the event and show him the photos I took,” Dewan said. “Since then, I have been following his journey on Instagram as a jazz musician part of the Juju Exchange [a musical partnership between Zaii and two childhood friends] and inventor of the Nova Portals, which I’ve always taken a fascination towards due to my interest in the intersection of technology and art.”
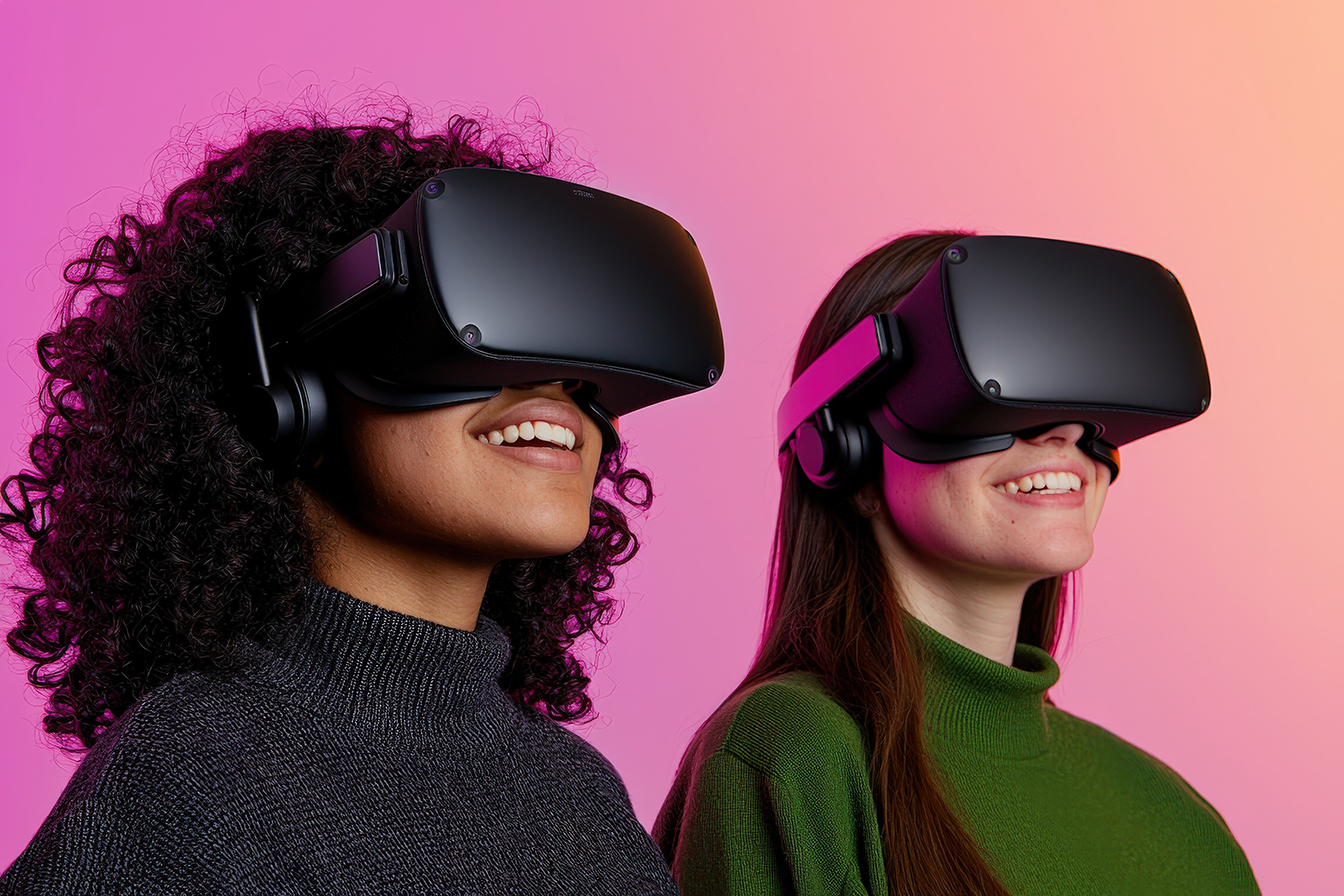
Following major hardware upgrades, the MIDEN’s image refresh rate has doubled, along with brighter light outputs, to support stereoscopic immersion for two simultaneous users — four perspective projections for four eyes, 60 times per second.
Sean Petty, senior software developer at the DMC’s Emerging Technologies Group, assisted the “Nova’s Reality” team inside the MIDEN and explained how the space was used.
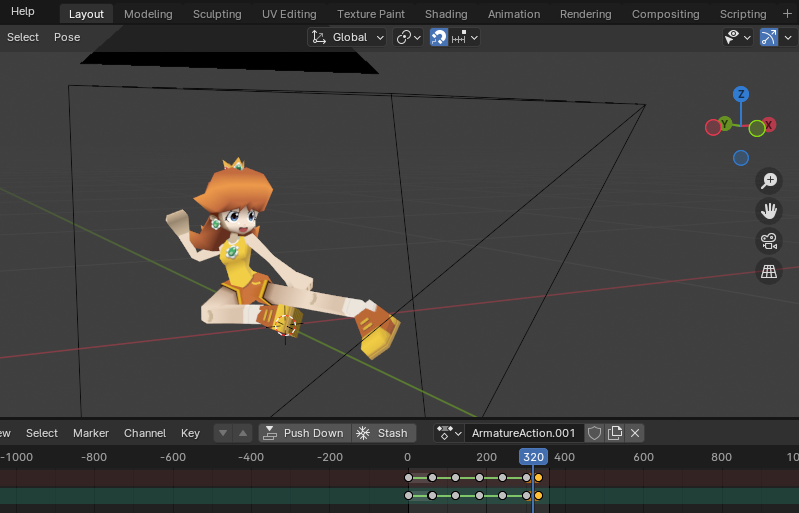
“This project is using the MIDEN as a virtual production space, where the MIDEN screens will deliver a perspective correct background that will make it appear as if the actor is actually in the virtual environment from the perspective of the camera,” Petty said. “To accommodate this, we modified the MIDEN to only display one image per frame, rather than the four that would be required for the usual two user VR experience. We also reconfigured the motion tracking to track the motion of the camera, rather than the motion of the VR glasses.”
The high-speed projection refresh rate of 240 scans per second allowed for a flicker-free recording by the video camera.
“This entire process was extremely inspiring for all of us involved, and maintains my strong drive to continue to find new, fresh interdisciplinary approaches to visualizing music,” said Dewan. After this project and their graduation, each member will also be continuing individual creative work.
The full project will be published on novazaii.com and akashdewan.com.

Photo Credit: Eilene Koo
Find more of their creative works through their Instagram profiles:
Performer & Inventor of the Nova Portals: Nova Zaii, @novazaii
Director, Co-Director of Photography, Editor, 3D Graphics Developer: Akash Dewan, @akashdewann
Audio Engineer/Technician: Adithya Sastr, @adithyasastry
3D Graphics Developer: Elvis Xiang
Co-Director of Photography: Gokul Madathil, @madlight.productions
BTS Photographer: Randall Xiao, @randysfoto
MIDEN Staff + Technical Support: Sean Petty and Theodore Hall

