Scientific Visualization of Pain
XR at the Headache & Orofacial Pain Effort (HOPE) Lab
Ted Hall
Dr. Alexandre DaSilva is an Associate Professor in the School of Dentistry, an Adjunct Associate Professor of Psychology in the College of Literature, Science & Arts, and a neuroscientist in the Molecular and Behavioral Neuroscience Institute. Dr. DaSilva and his associates study pain – not only its cause, but also its diagnosis and treatment – in his Headache & Orofacial Pain Effort (HOPE) Lab, located in the 300 N. Ingalls Building.
Virtual and augmented reality have been important tools in this endeavor, and Dr. DaSilva has brought several projects to the Digital Media Commons (DMC) in the Duderstadt Center over the years.
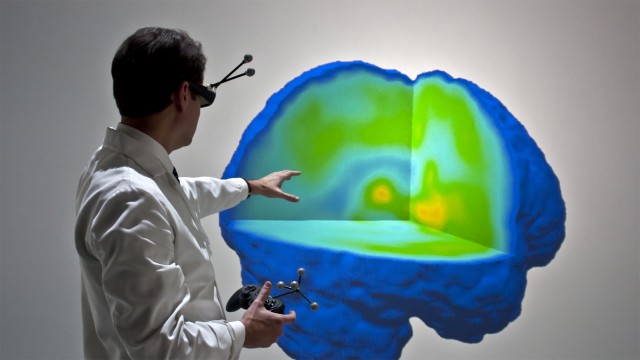
In one line of research, Dr. DaSilva has obtained positron emission tomography (PET) scans of patients in the throes of migraine headaches. The raw data obtained from these scans are three-dimensional arrays of numbers that encode the activation levels of dopamine or μ-opioid in small “finite element” volumes of the brain. As such, they’re incomprehensible. But, we bring the data to life through DMC-developed software that maps the numbers into a blue-to-red color gradient and renders the elements in stereoscopic 3D virtual reality (VR) – in the Michigan Immersive Digital Experience Nexus (MIDEN), or in head-mounted displays such as the Oculus Rift. In VR, the user can effortlessly slide section planes through the volumes of data, at any angle or offset, to hunt for the red areas where the dopamine or μ-opioid signals are strongest. Understanding how migraine headaches affect the brain may help in devising more focused and effective treatments.
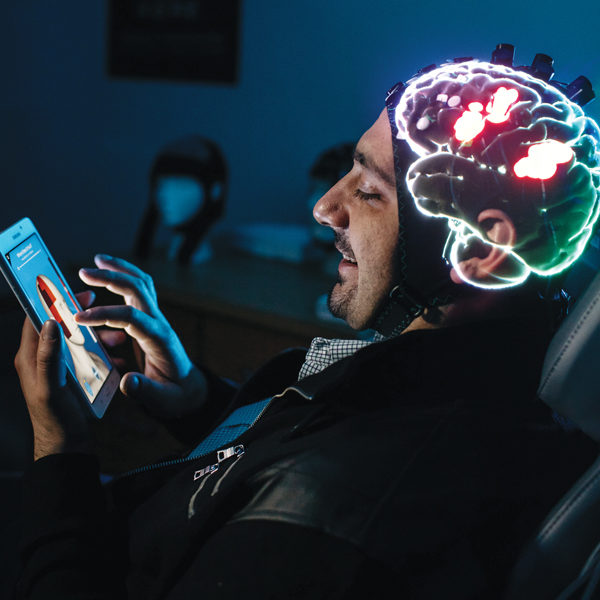
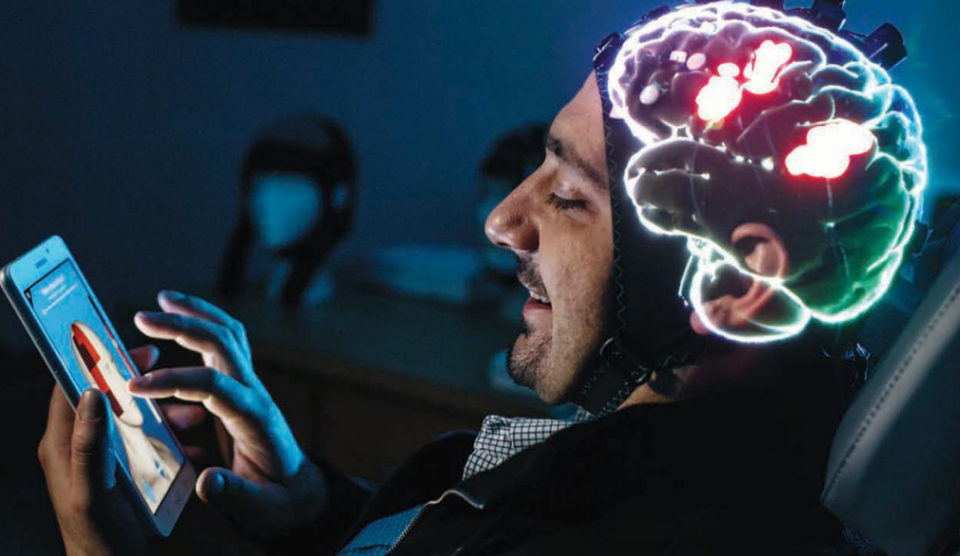
In another line of research, Dr. DaSilva employs functional near-infrared spectroscopy (fNIRS) to directly observe brain activity associated with pain in “real time”, as the patient experiences it. As Wikipedia describes it: “Using fNIRS, brain activity is measured by using near-infrared light to estimate cortical hemodynamic activity which occur in response to neural activity.” [https://en.wikipedia.org/wiki/Functional_near-infrared_spectroscopy] The study participant wears an elastic skullcap fitted with dozens of fNIRS sensors wired to a control box, which digitizes the signal inputs and sends the numeric data to a personal computer running a MATLAB script. From there, a two-part software development by the DMC enables neuroscientists to visualize the data in augmented reality (AR). The first part is a MATLAB function that opens a Wi-Fi connection to a Microsoft HoloLens and streams the numeric data out to it. The second part is a HoloLens app that receives that data stream and renders it as blobs of light that change hue and size to represent the ± polarity and intensity of each signal. The translucent nature of HoloLens AR rendering allows the neuroscientist to overlay this real-time data visualization on the actual patient. Being able to directly observe neural activity associated with pain may enable a more objective scale, versus asking a patient to verbally rate their pain, for example “on a scale of 1 to 5”. Moreover, it may be especially helpful for diagnosing or empathizing with patients who are unable to express their sensations verbally at all, whether due to simple language barriers or due to other complicating factors such as autism, dementia, or stroke.
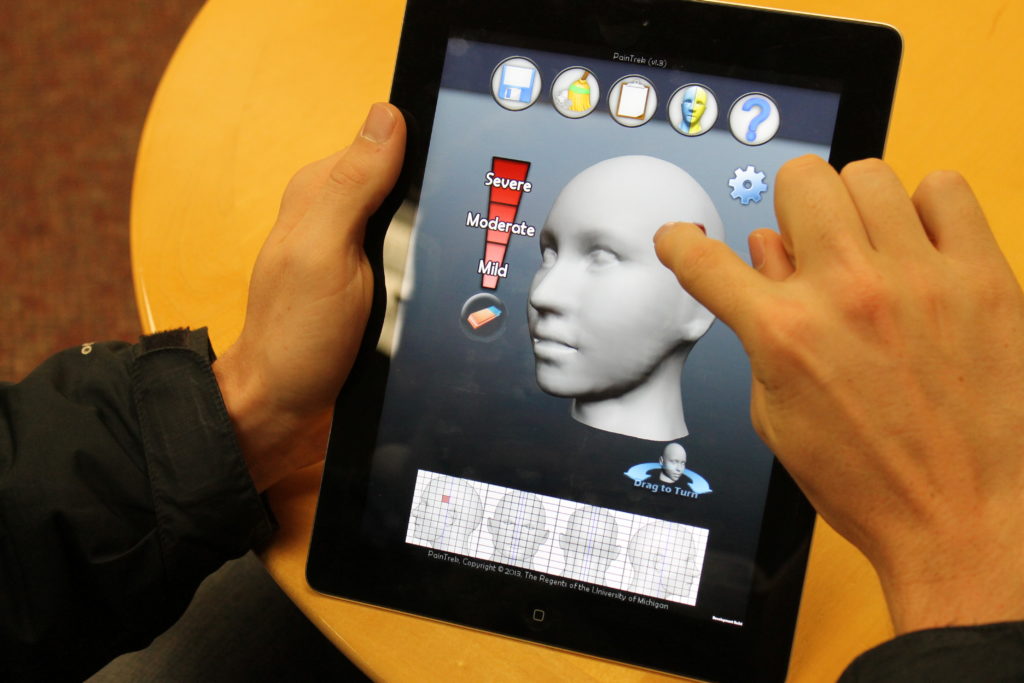
Yet another DMC software development, the “PainTrek” mobile application also started by Dr. DaSilva, allows patients to “paint their pain” on an image of a manikin head that can be rotated freely on the screen, as a more convenient and intuitive reporting mechanism than filling out a common questionnaire.